
Panels & Overlays
With LIME it is simple to integrate a wide range of imagery into your 3D environment using Panels.
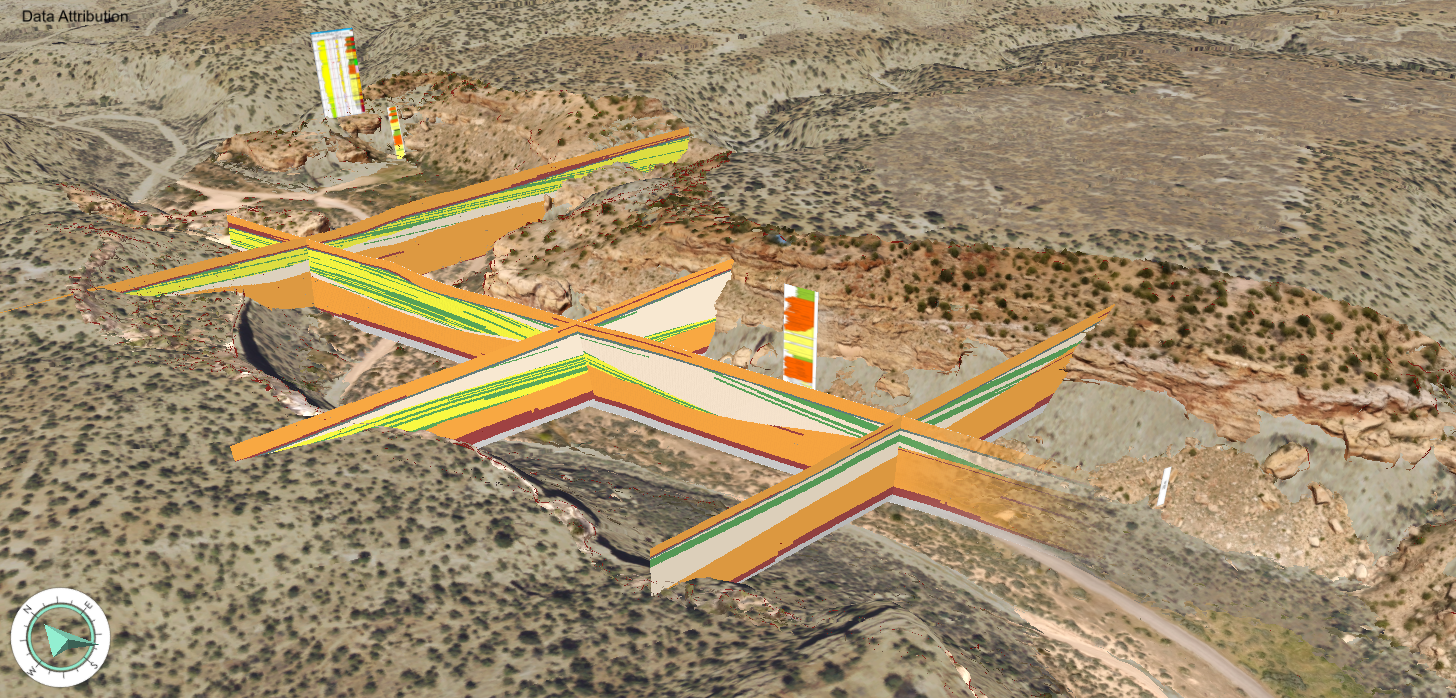
Drag and drop images in the 3D scene, and use the georeferencing tools to position them exactly where they need to be to contribute to your geoscience narrative. A Panel can then be projected on to a 3D model for impressive co-visualisation.

Panel Image Types
A Panel can represent any sort of image. Typical examples are:
- Field data (logs, photos)
- Georeferenced imagery (maps, imagery, geological/thematic maps etc)
- Subsurface well logs
- Core images
- Interpretation panels, cross sections, multi/hyperspectral imaging results
- Reservoir modelling sections
- Geophysical sections
- Diagrams, figures
- Slides, animated GIFs, scale bars and more
The only limit is your imagination!
Make Effective Visualisations
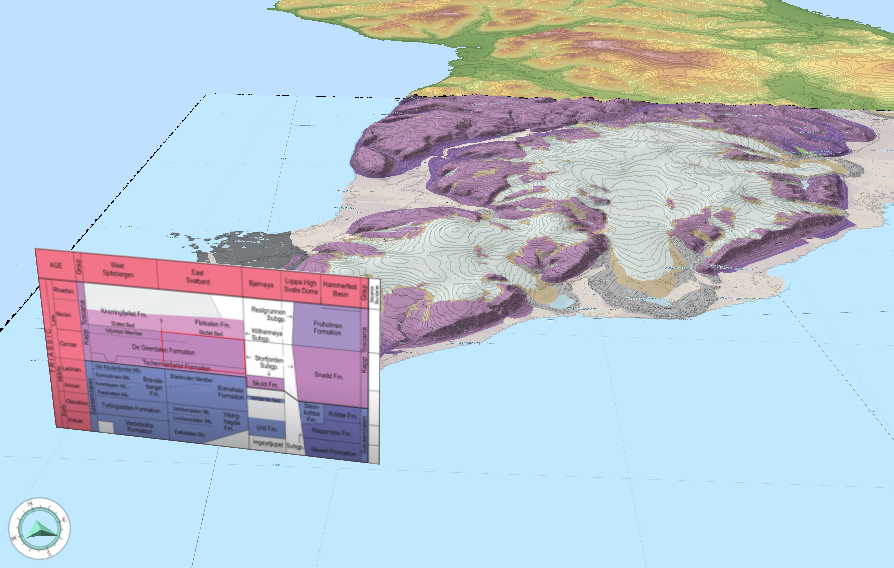
Using LIME's visualisation framework, it is easy make creative views of your data for presentations, figures, virtual field trips and more.
Blend overlay layers, add lighting, transparency and more to communicate your results to stakeholders and collaborators.
Panel Projections
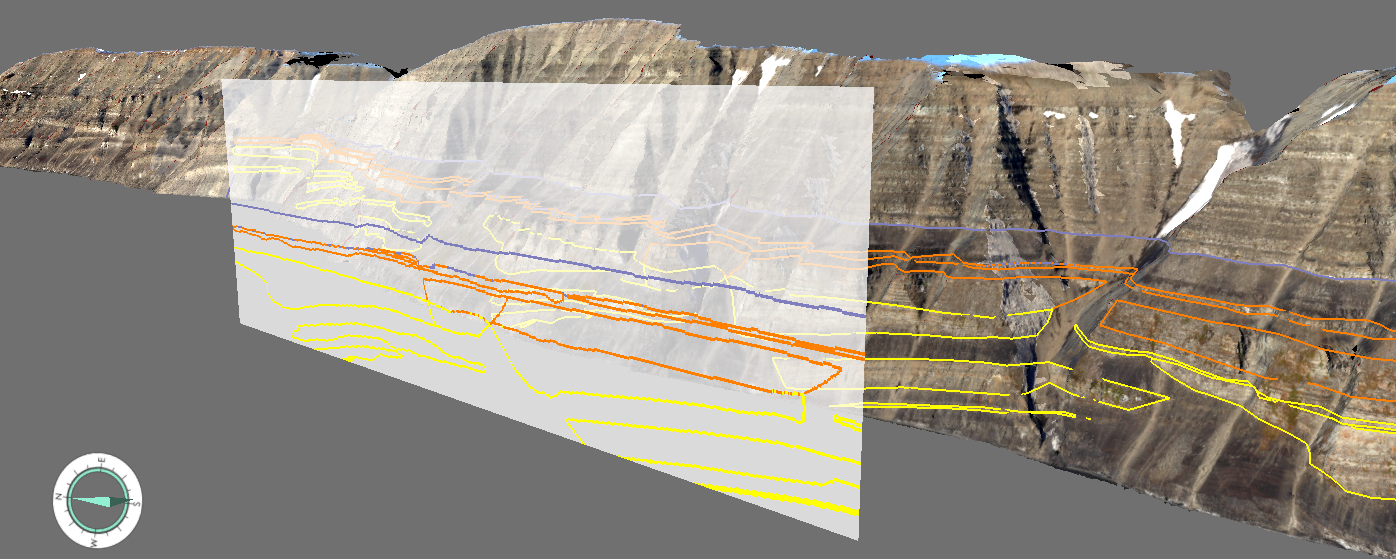
Project your 3D data to Panels to create new orthorectified (map) images with custom resolution. This could be your line interpretations, or true scale view of your 3D model. Export projected layers in standard image formats for further annotation or editing.
Because of the tightly coupled Panel georeferencing, you can always import new annotated image layers back to the Panel and drape them on the 3D model data.
Geophysical image integration
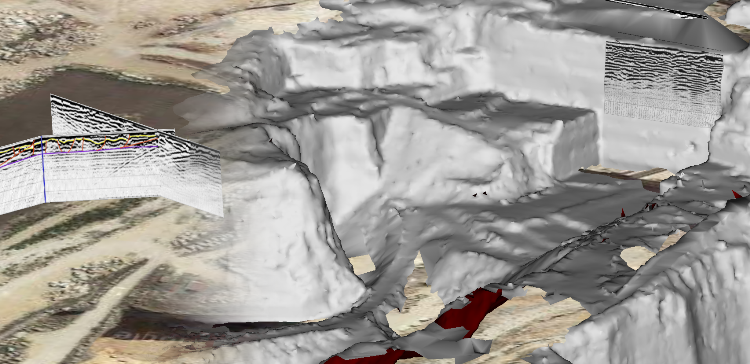
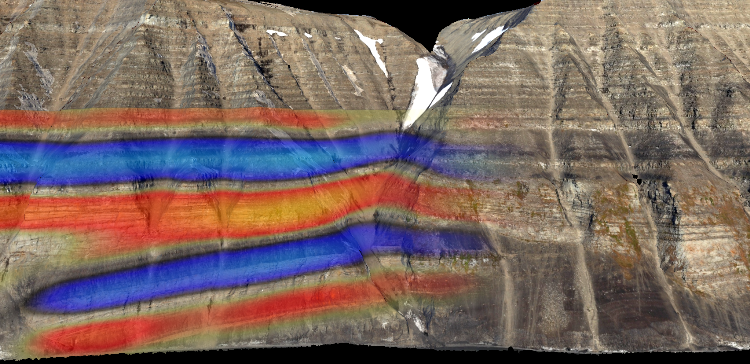
A powerful feature of LIME is the ability to import geophysical data panels representing 2D subsurface sections, such as from ground penetrating radar (GPR) or seismic data. The images are positioned in the 3D scene using Panels, allowing them to be overlain on any 3D surface model. This provides a unique ability to directly compare exposed topography with subsurface datasets, to aid correlation, quality control, and presentation.
Using the same approach, other types of subsurface data can easily be integrated into LIME as panels. Examples are cross sections through geocellular grids, well log data or core imagery, which can be used to aid characterisation and interpretation of your outcrop, as well as present your results to colleagues and collaborators.
Further reading
Anell, I., Lecomte, I., Braathen, A., and S. J. Buckley, 2016, Synthetic seismic illumination of small-scale growth faults, paralic deposits and low-angle clinoforms: A case study of the Triassic successions on Edgeøya, NW Barents Shelf, Marine and Petroleum Geology, 625-639, doi:10.1016/j.marpetgeo.2016.07.005.
Buckley, S.J., Ringdal, K., Naumann, N., Dolva, B., Kurz, T.H., Howell, J.A., Dewez, T.J.B., 2019. LIME: Software for 3-D visualization, interpretation, and communication of virtual geoscience models, Geosphere, 15(1): 222-235. doi:10.1130/GES02002.1.
Eide, C.H., Schofield, N., Lecomte, I., Buckley, S.J., Howell, J.,A., 2018. Seismic interpretation of sill complexes in sedimentary basins: Implications for the sub-sill imaging problem. Journal of the Geological Society, 175(2): 193-209. doi:10.1144/jgs2017-096.
Lecomte, I., 2019. From Outcrop Geology to Seismic… and Back! GeoExpro, 16(4): link.
