Overlays & image integration
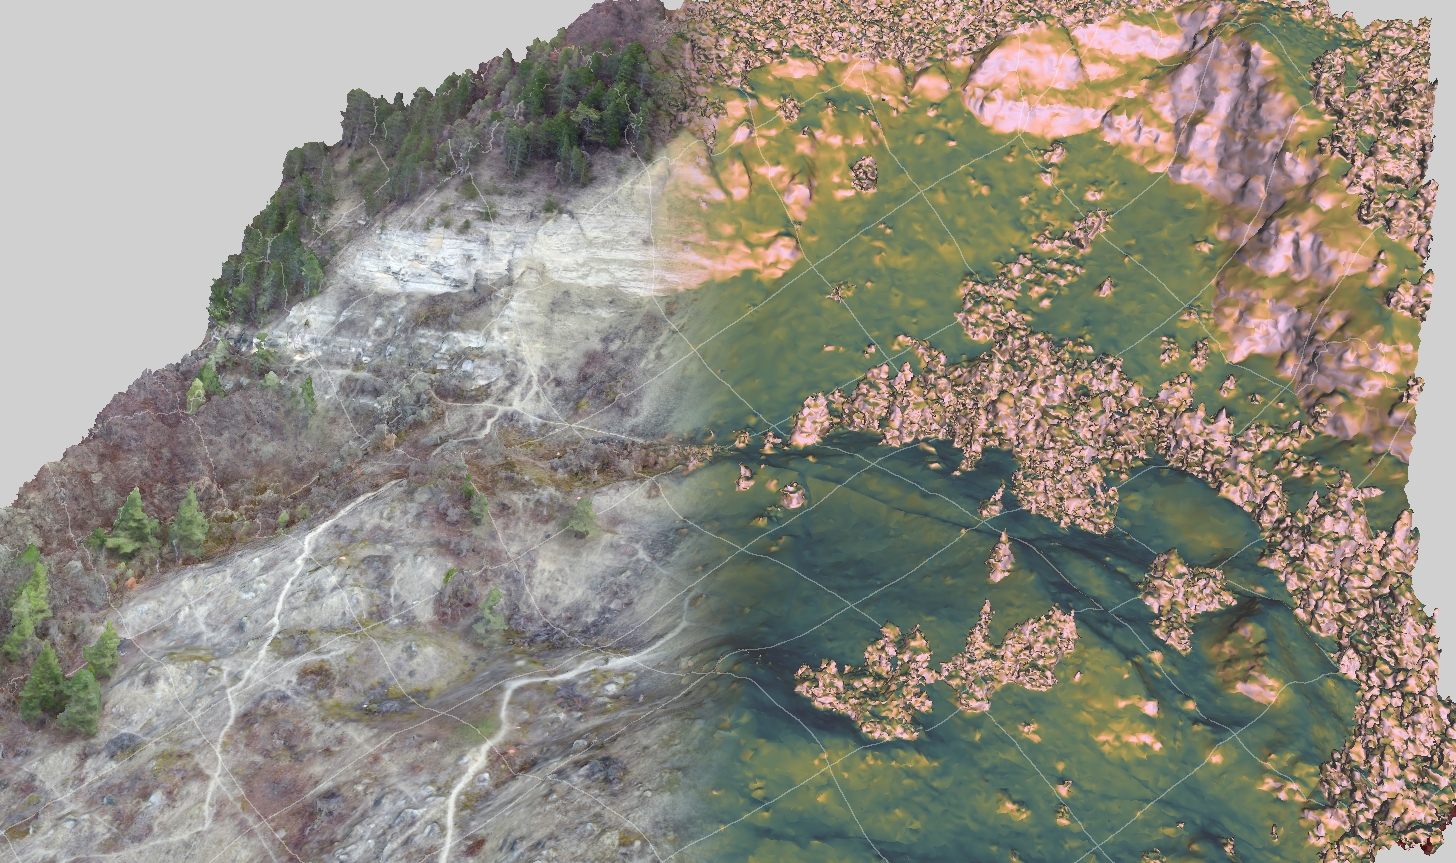
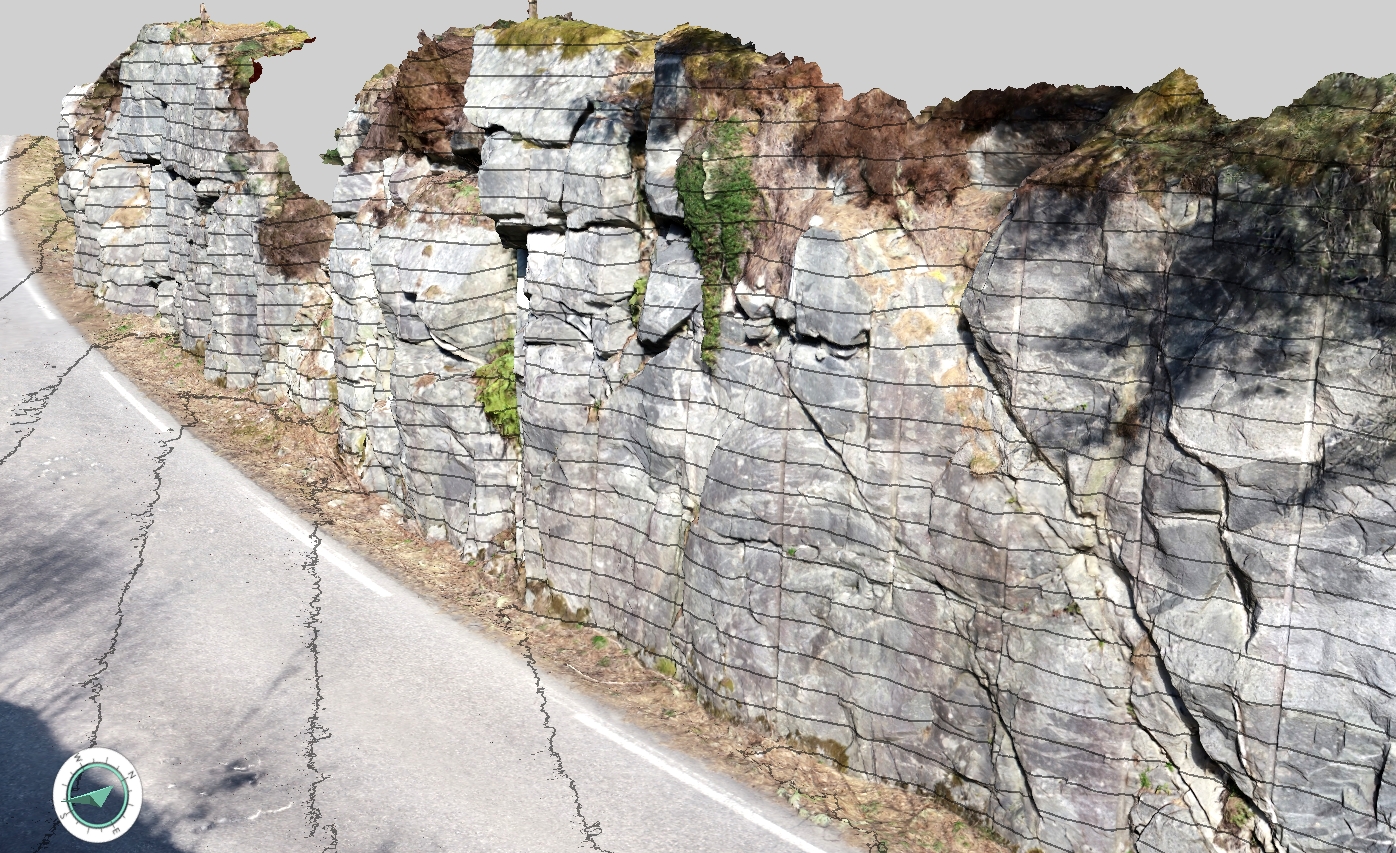
Source: Dahlin, A. (2022) Svalbox-DOM_2021-0025_Landnørdingsvika. doi:10.5281/zenodo.6321229
Panels
Panels are a new addition to LIME, and make use of the advanced visual framework to integrate multiple data types into the 3D scene. A Panel is essentially a plane in 3D space which can be used for two main purposes:
- Projection of 3D scene objects onto Panels to create orthorectified inputs for interpretation and annotation;
- Projection of imagery from Panel space onto 3D models, resulting in new texture layers.
Panels are positioned as objects in the 3D scene and are associated with images. Images can be generated by projecting data from the 3D scene onto the Panel (e.g. lines, planes, models) to give orthorectified (uniform scale) images, which can be exported, edited and then overlaid back on the 3D model. Examples of usage are to create interpretation panels or annotated texture layers that can be draped onto 3D models.

Image placement
In LIME, Panels are also used to position images in the 3D scene. Examples are for logs, field photos and geophysical data. Of course, any Panel object can be draped onto a corresponding model in the 3D scene.
Image overlays
LIME can be used to display models with multiple texture layers, such as where different image datasets are integrated. Examples are from hyperspectral imaging, where material mapping results can be overlaid on the photorealistic models. This significantly aids interpretation and verification of results. Texture layers can be combined in a sophisticated manner by blending between overlay layers.
Geophysical image integration
A powerful feature of LIME is the ability to import geophysical data panels representing 2D sections through the subsurface, such as from ground penetrating radar (GPR) or seismic data. The images are positioned in the 3D scene using Panels, allowing them to be overlain on any 3D surface model. This provides a unique ability to directly compare exposed topography with subsurface datasets, to aid correlation, quality control, and presentation of results.
Using the same approach, other types of subsurface data can easily be integrated into LIME as panels. Examples are cross sections through geocellular grids, well log data or core imagery, which can be used to aid characterisation and interpretation of your outcrop, as well as present your results to colleagues and collaborators.
Further reading
Anell, I., Lecomte, I., Braathen, A., and S. J. Buckley, 2016, Synthetic seismic illumination of small-scale growth faults, paralic deposits and low-angle clinoforms: A case study of the Triassic successions on Edgeøya, NW Barents Shelf, Marine and Petroleum Geology, 625-639, doi:10.1016/j.marpetgeo.2016.07.005.
Buckley, S.J., Ringdal, K., Naumann, N., Dolva, B., Kurz, T.H., Howell, J.A., Dewez, T.J.B., 2019. LIME: Software for 3-D visualization, interpretation, and communication of virtual geoscience models, Geosphere, 15(1): 222-235. doi:10.1130/GES02002.1.
Eide, C.H., Schofield, N., Lecomte, I., Buckley, S.J., Howell, J.,A., 2018. Seismic interpretation of sill complexes in sedimentary basins: Implications for the sub-sill imaging problem. Journal of the Geological Society, 175(2): 193-209. doi:10.1144/jgs2017-096.
Lecomte, I., 2019. From Outcrop Geology to Seismic… and Back! GeoExpro, 16(4): link.


